Xu, Wen; Chen, Wei-Qiang*; Jiang, Daqian; Zhang, Chao; Ma, Zijie; Ren, Yan; Shi, Lei
Ecosystem Health and Sustainability 2020 6, 1756925. DOI: 10.1080/20964129.2020.1756925
Abstract
Introduction:China’s import bans on solid wastes starting from 2017 have challenged theglobal trade system of plastic wastes, which remains poorly characterized. This study choosespolyethylene (PE) as a case and aims to map out the global trade networks of PE waste (GPETN)from 1976 to 2017.Outcomes:Wefind that the size and complexity of the GPETN had been growing until 2016. Afterthe mid-1990s, PE waste basicallyflowed from developed economies, mainly the EU and the US, todeveloping economies such as China. Since 2001 when admitted into the WTO, China’sPEwasteimport surged until 2014 when it absorbed over 60% of global export. Regulations on solid wasteimport following the Green Fence campaign in 2013 resulted in substantial reductions in China’simport as well as the global export of PE waste after 2014. Several other developing economies, suchas Malaysia, Turkey, and Vietnam, had transitioned to net importers, but their imports were insuffi-cient to replace China as new recycling bases for PE waste.Conclusion: The results highlight the urgent need of a joint effort for developed and devel-oping countries to build a stronger global circular economy system with sufficient capacity totreat PE waste locally.
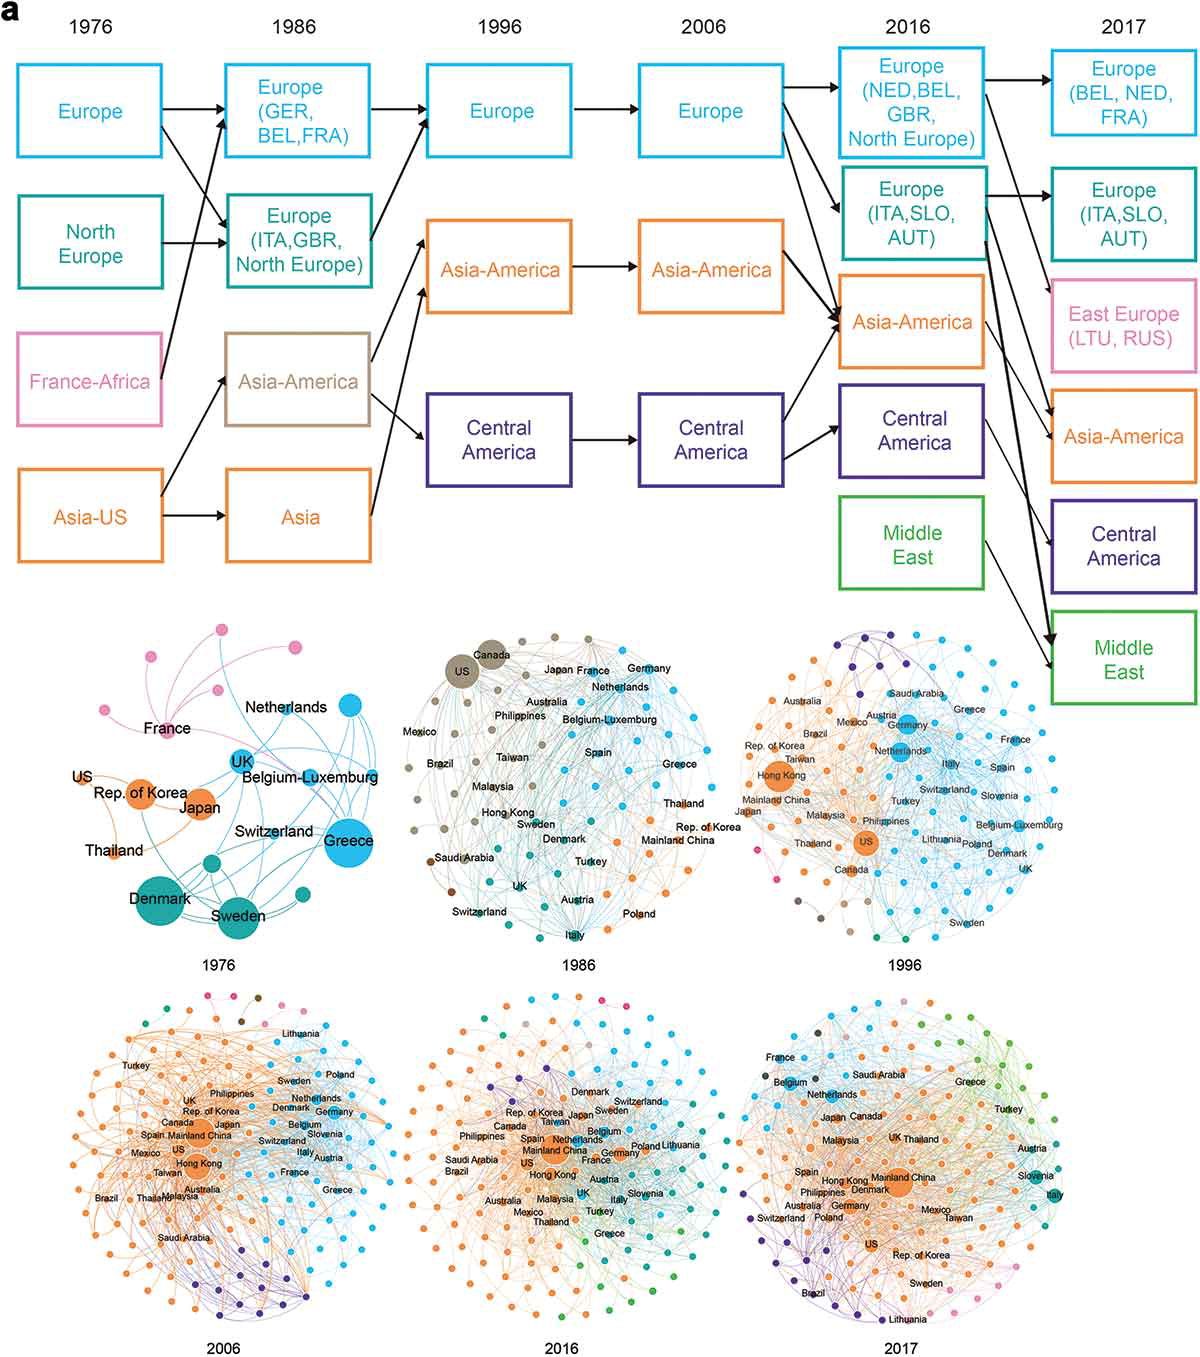
The evolution of PE waste trade communities with more than three members in 1976, 1986, 1996, 2006, 2016, and 2017. One color represents one community. The colors of boxes in the flow chart correspond with the color nodes in the network graph, the same color representing the same community. The size of nodes represents the trade mass of the country relative to global trade mass.