Shi, Jiujie; Zhang, Chao*; Chen, Wei-Qiang*
Sustainable Production and Consumption 2021 25, 187-197. DOI: 10.1016/j.spc.2020.08.005
Abstract
Soaring consumption of plastic products globally generates vast amount of plastic wastes, which has been a grand challenge for today's solid waste management system. China has been the world largest importer of plastic wastes for the last three decades. However, due to growing environmental awareness, China decided to stop importing plastic wastes in 2017. This study analyzes the historical evolution of the international plastic wastes trade by using complex network analysis method and shows that China's management policies are the main driving forces to the expansion and shrinkage of the global plastic wastes trade network. We find that the trade network grew most tremendously during mid-1990s to early 2010s. The global total trade volume increased from 0.9 million tons in 1992 to 16.4 million tons in 2012, and the number of trade connections increased from 452 to 2248 during the same period. 2–6% of the trade relations contributed more than 80% of the global total trade volumes. Trade flows among continents or sub-continental regions increased from 38% to 64% during 1997–2012, indicating longer transport distances and spatially more separated trade partners in the network. Results also show that the growth trend stagnated and the network became multipolar again after 2012, when China launched a series of campaigns to strengthen regulations on solid wastes import. China's import ban on plastic wastes issued in 2017 led to a dramatic decline of trade volumes. More and more stringent environmental protection measures in China and other developing countries are transforming the geographic pattern of global waste trade network and may drive developed countries to reconstruct their recycling systems.
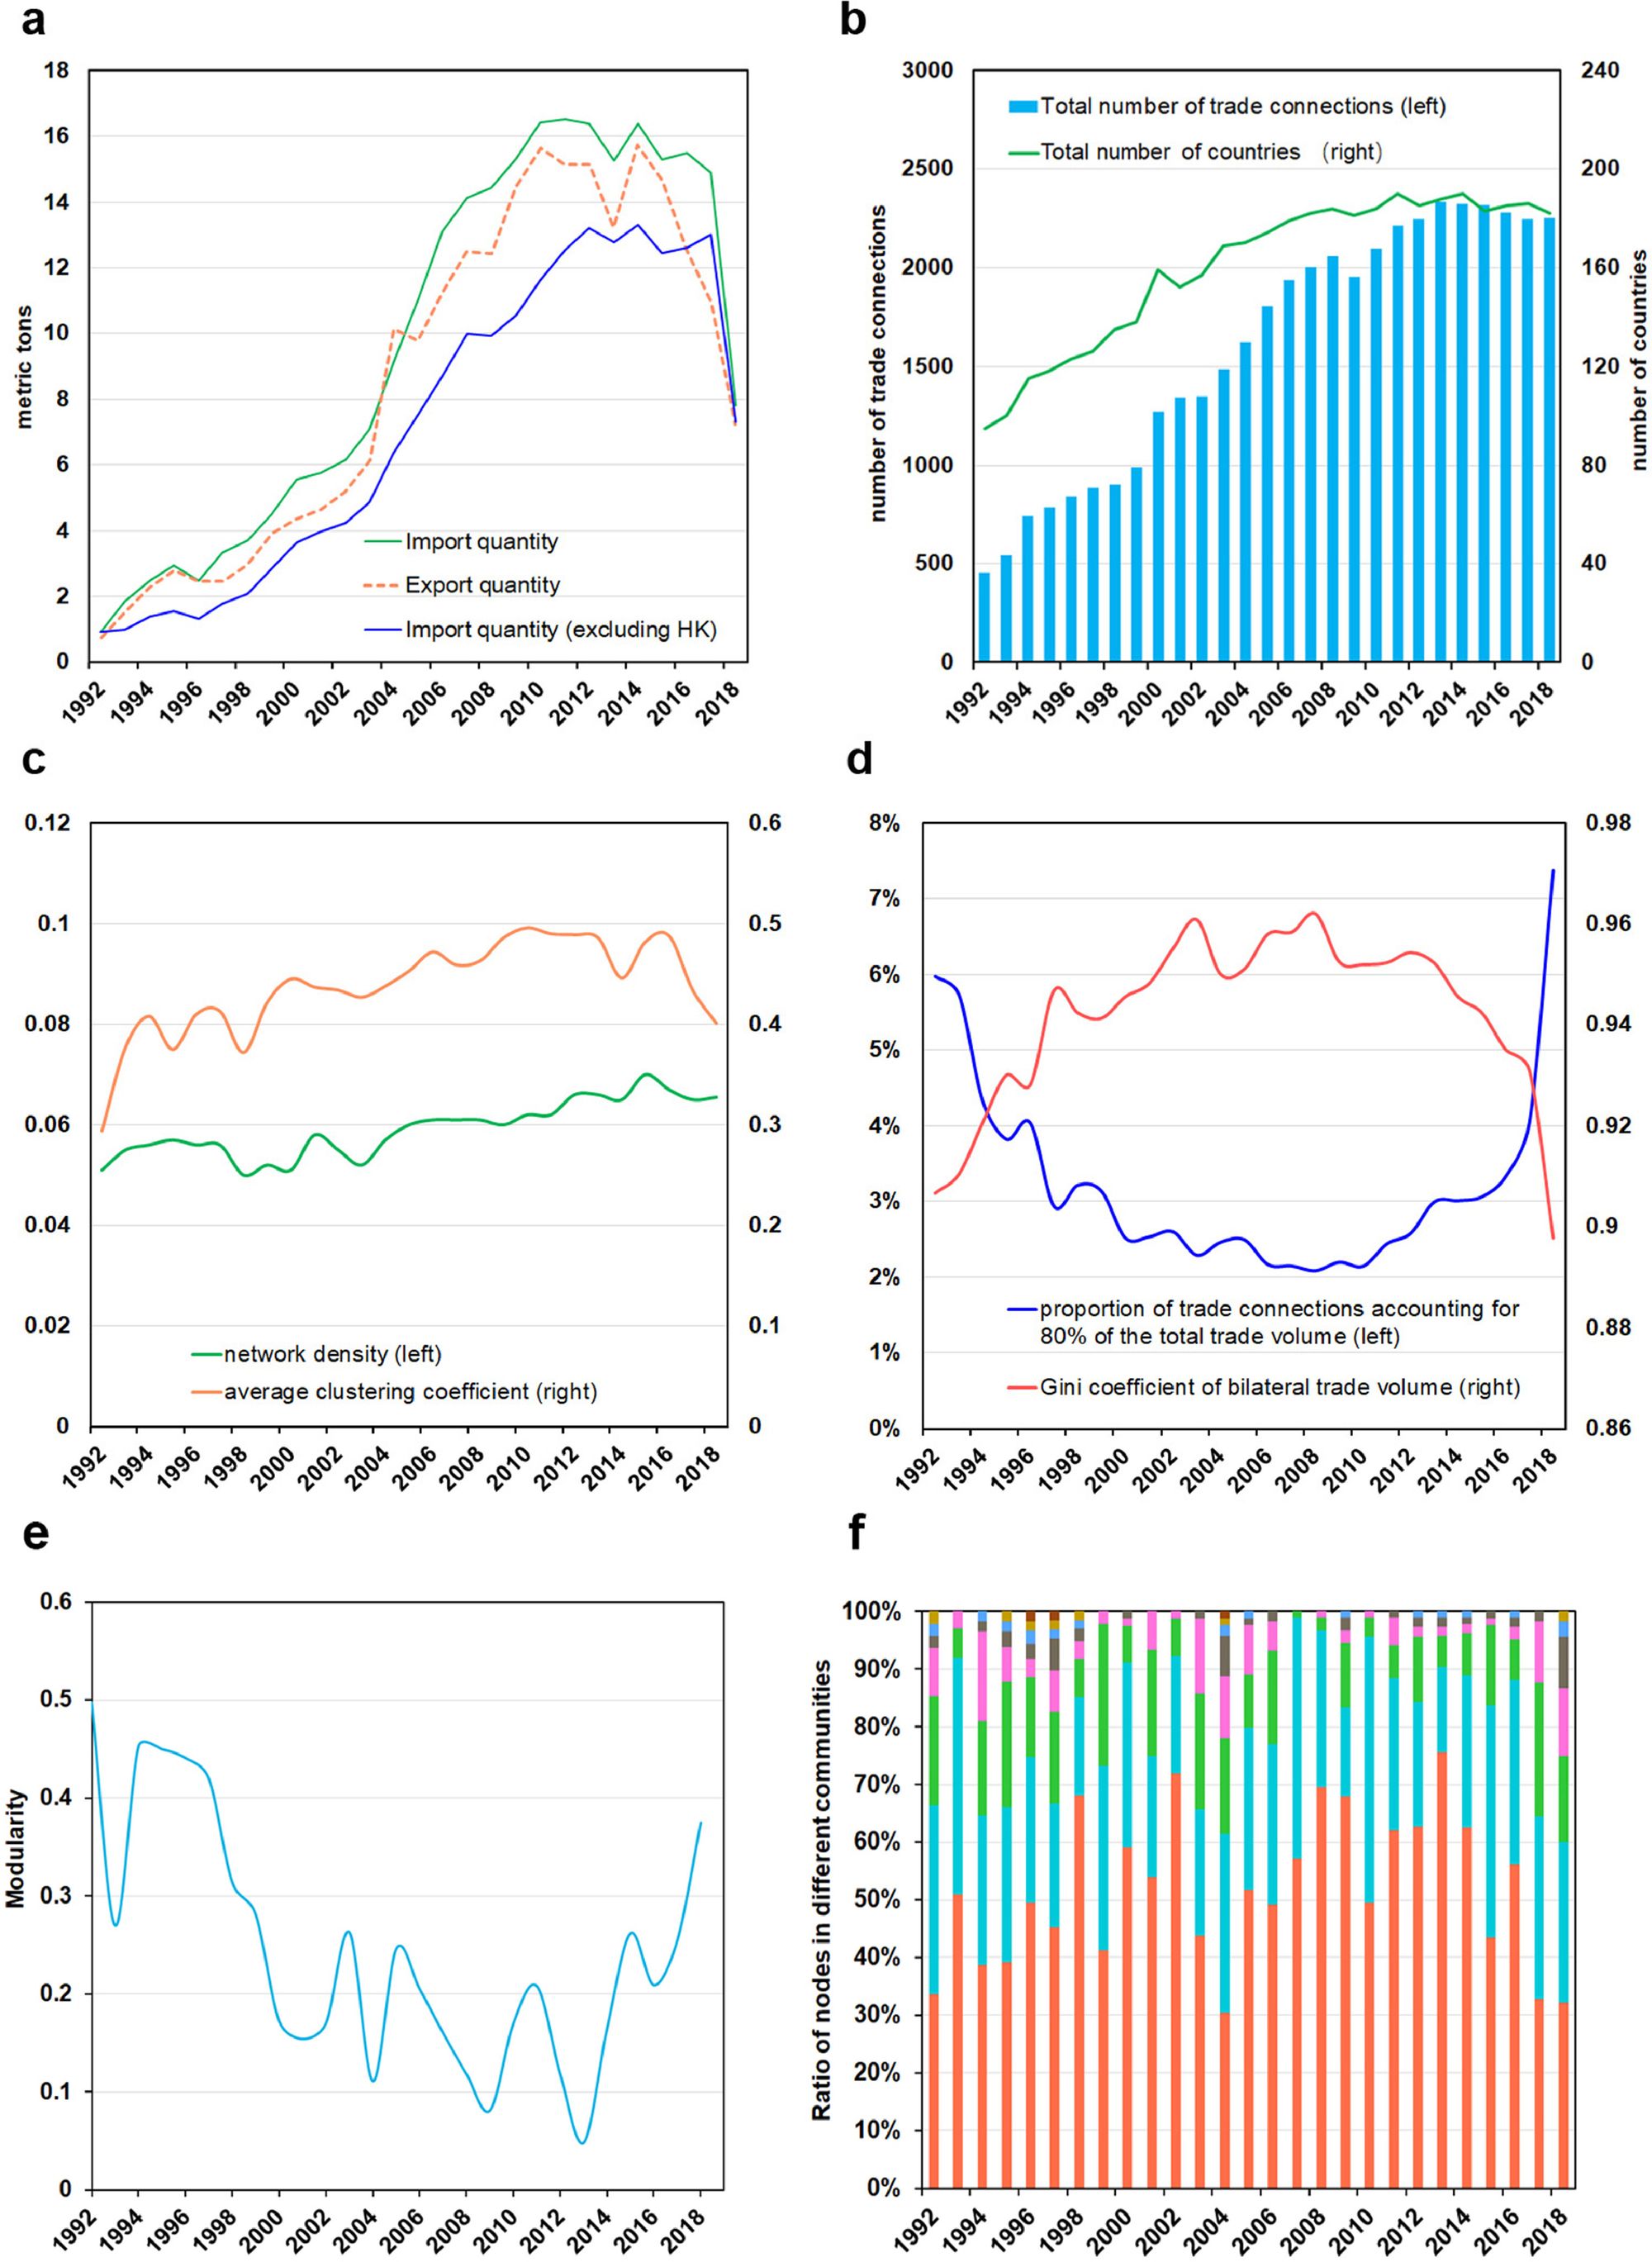
(a) Global total trade volumes of plastic wastes, (b) Total number of countries and trade connections, (c) Trend of network density and average clustering coefficient, (d) Proportion of trade connections accounting for 80% of the total trade volume and Gini coefficient of trade connections, (e) The modularity of international trade network of plastic wastes, (f) The proportion of countries in different communities.
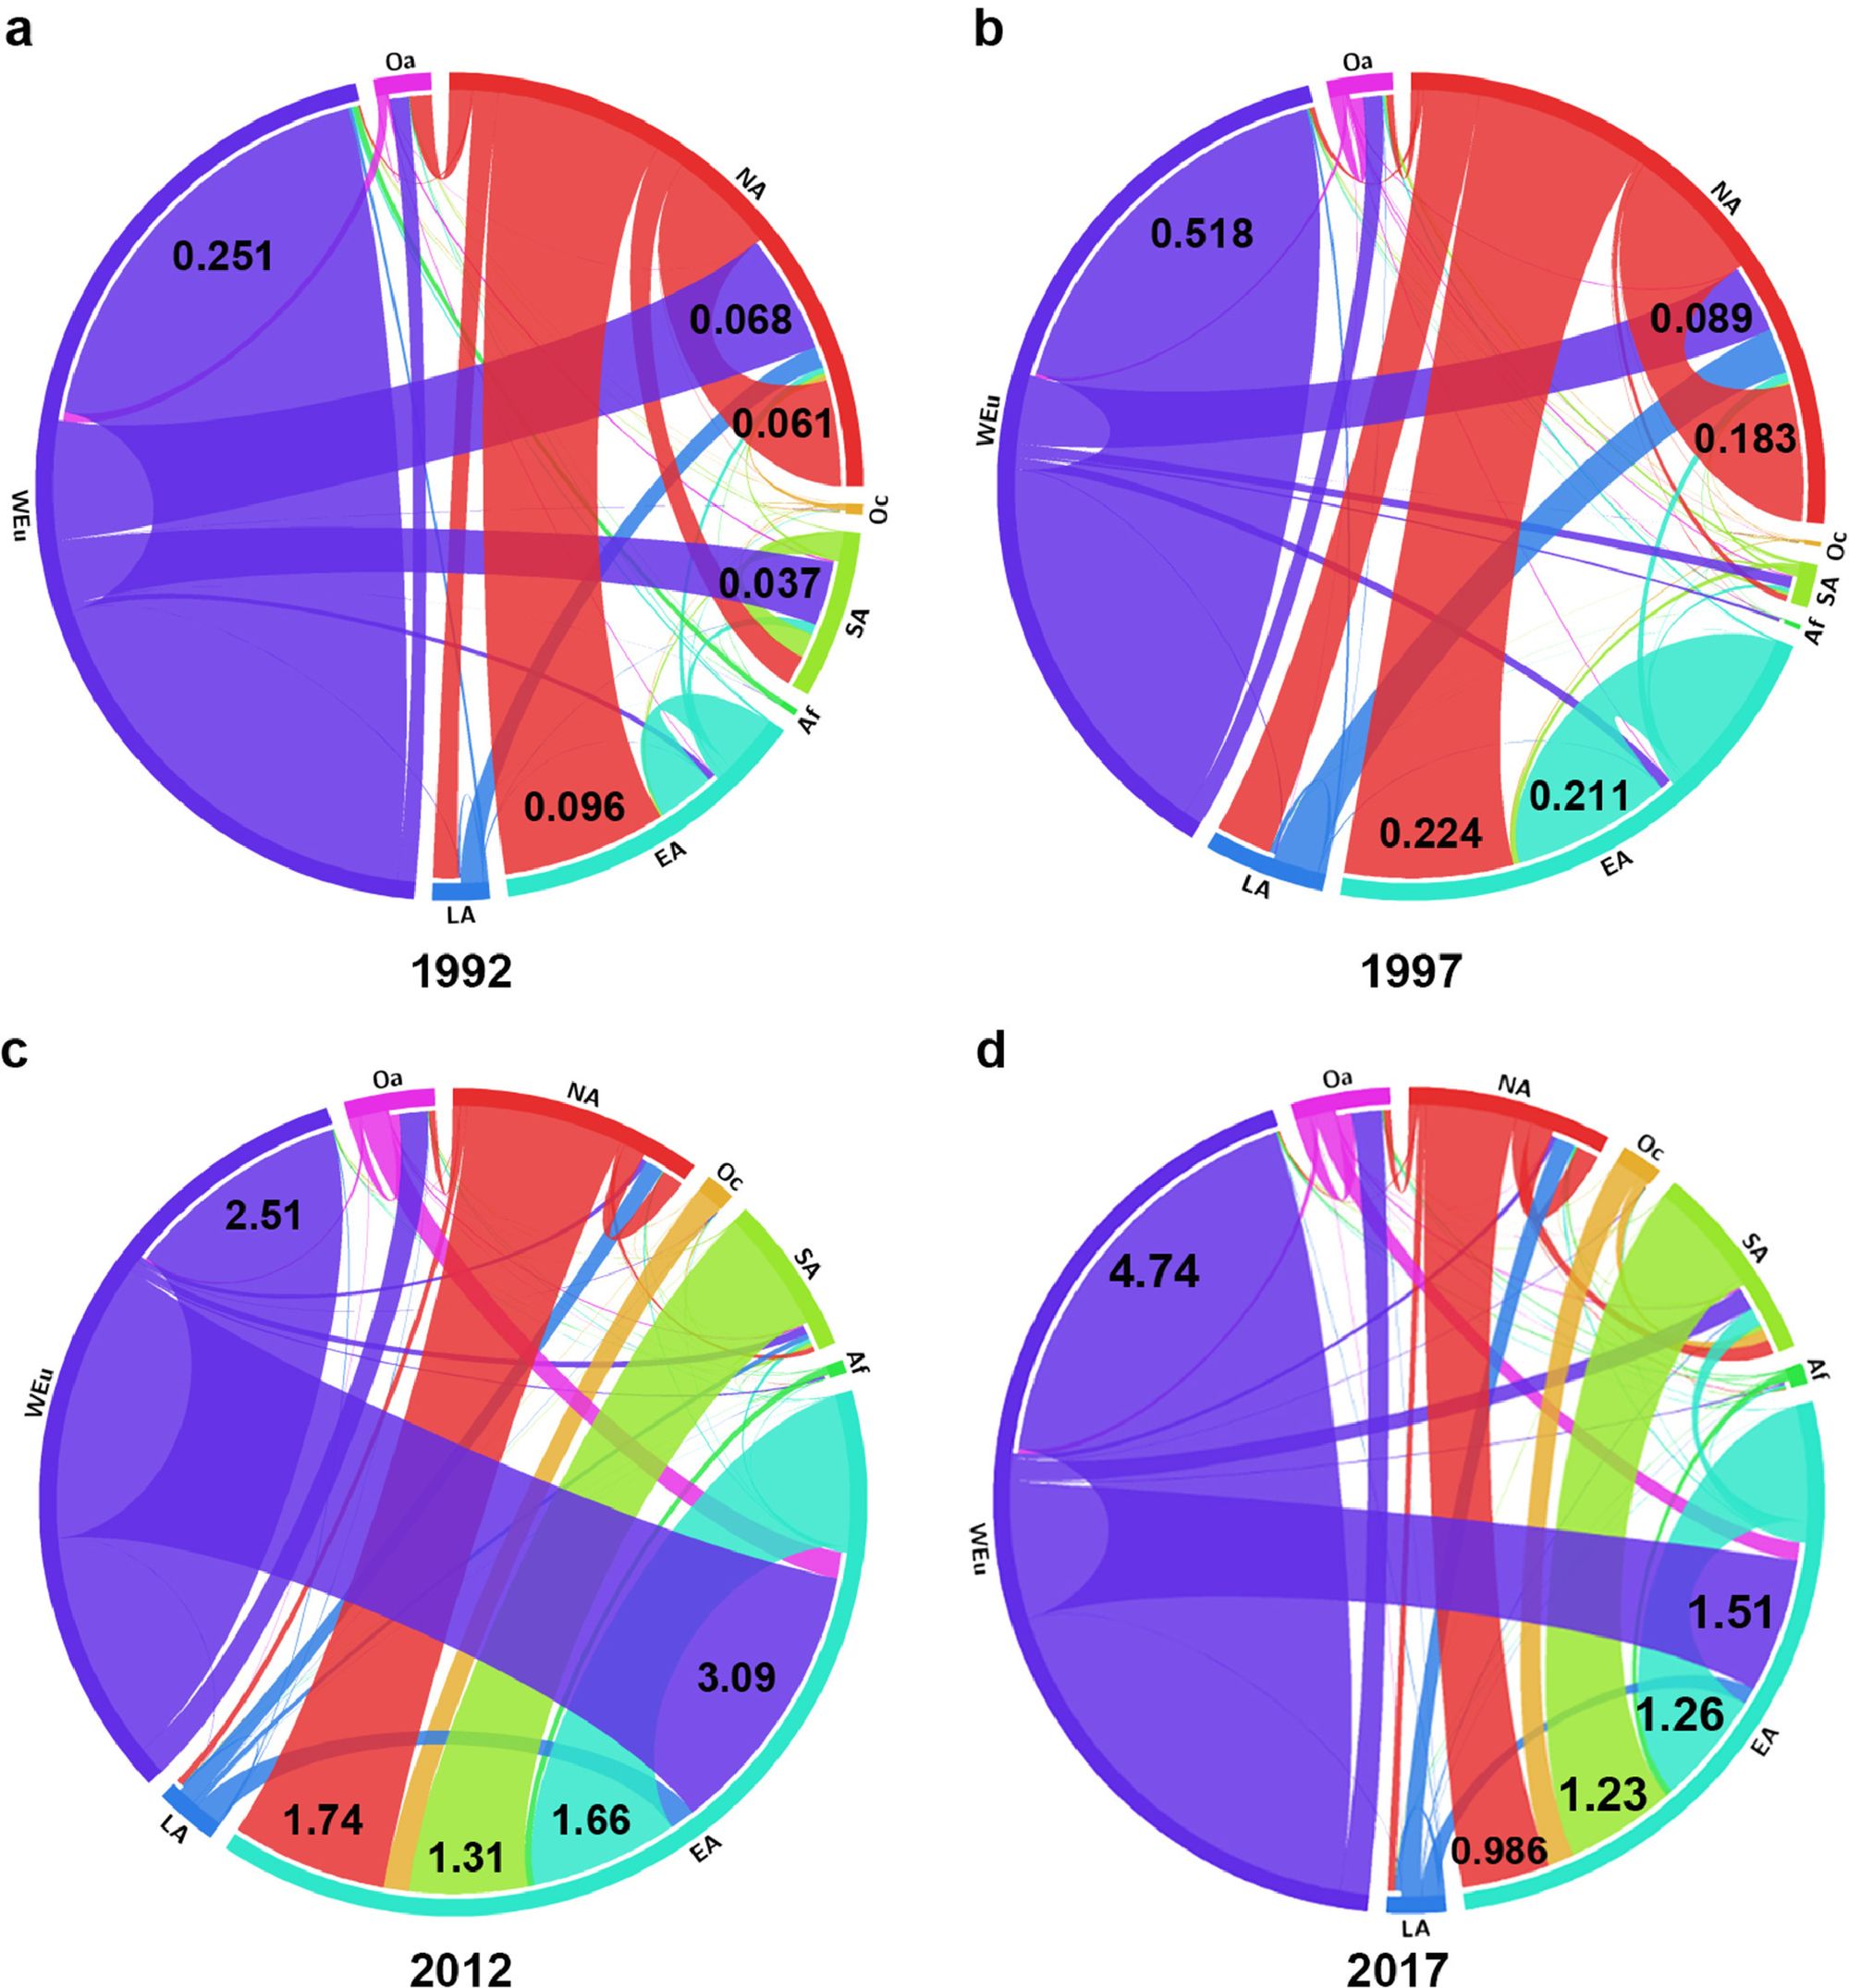
Trade flows crossing continents or sub-continental regions (MMT) in 1992(a), 1997(b), 2012(c) and 2017(d). WEu: Western Europe, LA: Latin America, EA: East Asia, Af: Africa, SA: Southeast Asia, Oc: Oceania, NA: Northern America, Oa: Other regions (including Eastern Europe, the Middle East and Central Asia).