Chen, Jinjin; Tang, Linbin; Chen, Wei-Qiang*; Peaslee, Graham F.; Jiang, Daqian
Environmental Science & Technology 2020 54 (11),6908–6918. DOI: 10.1021/acs.est.9b06956
Abstract
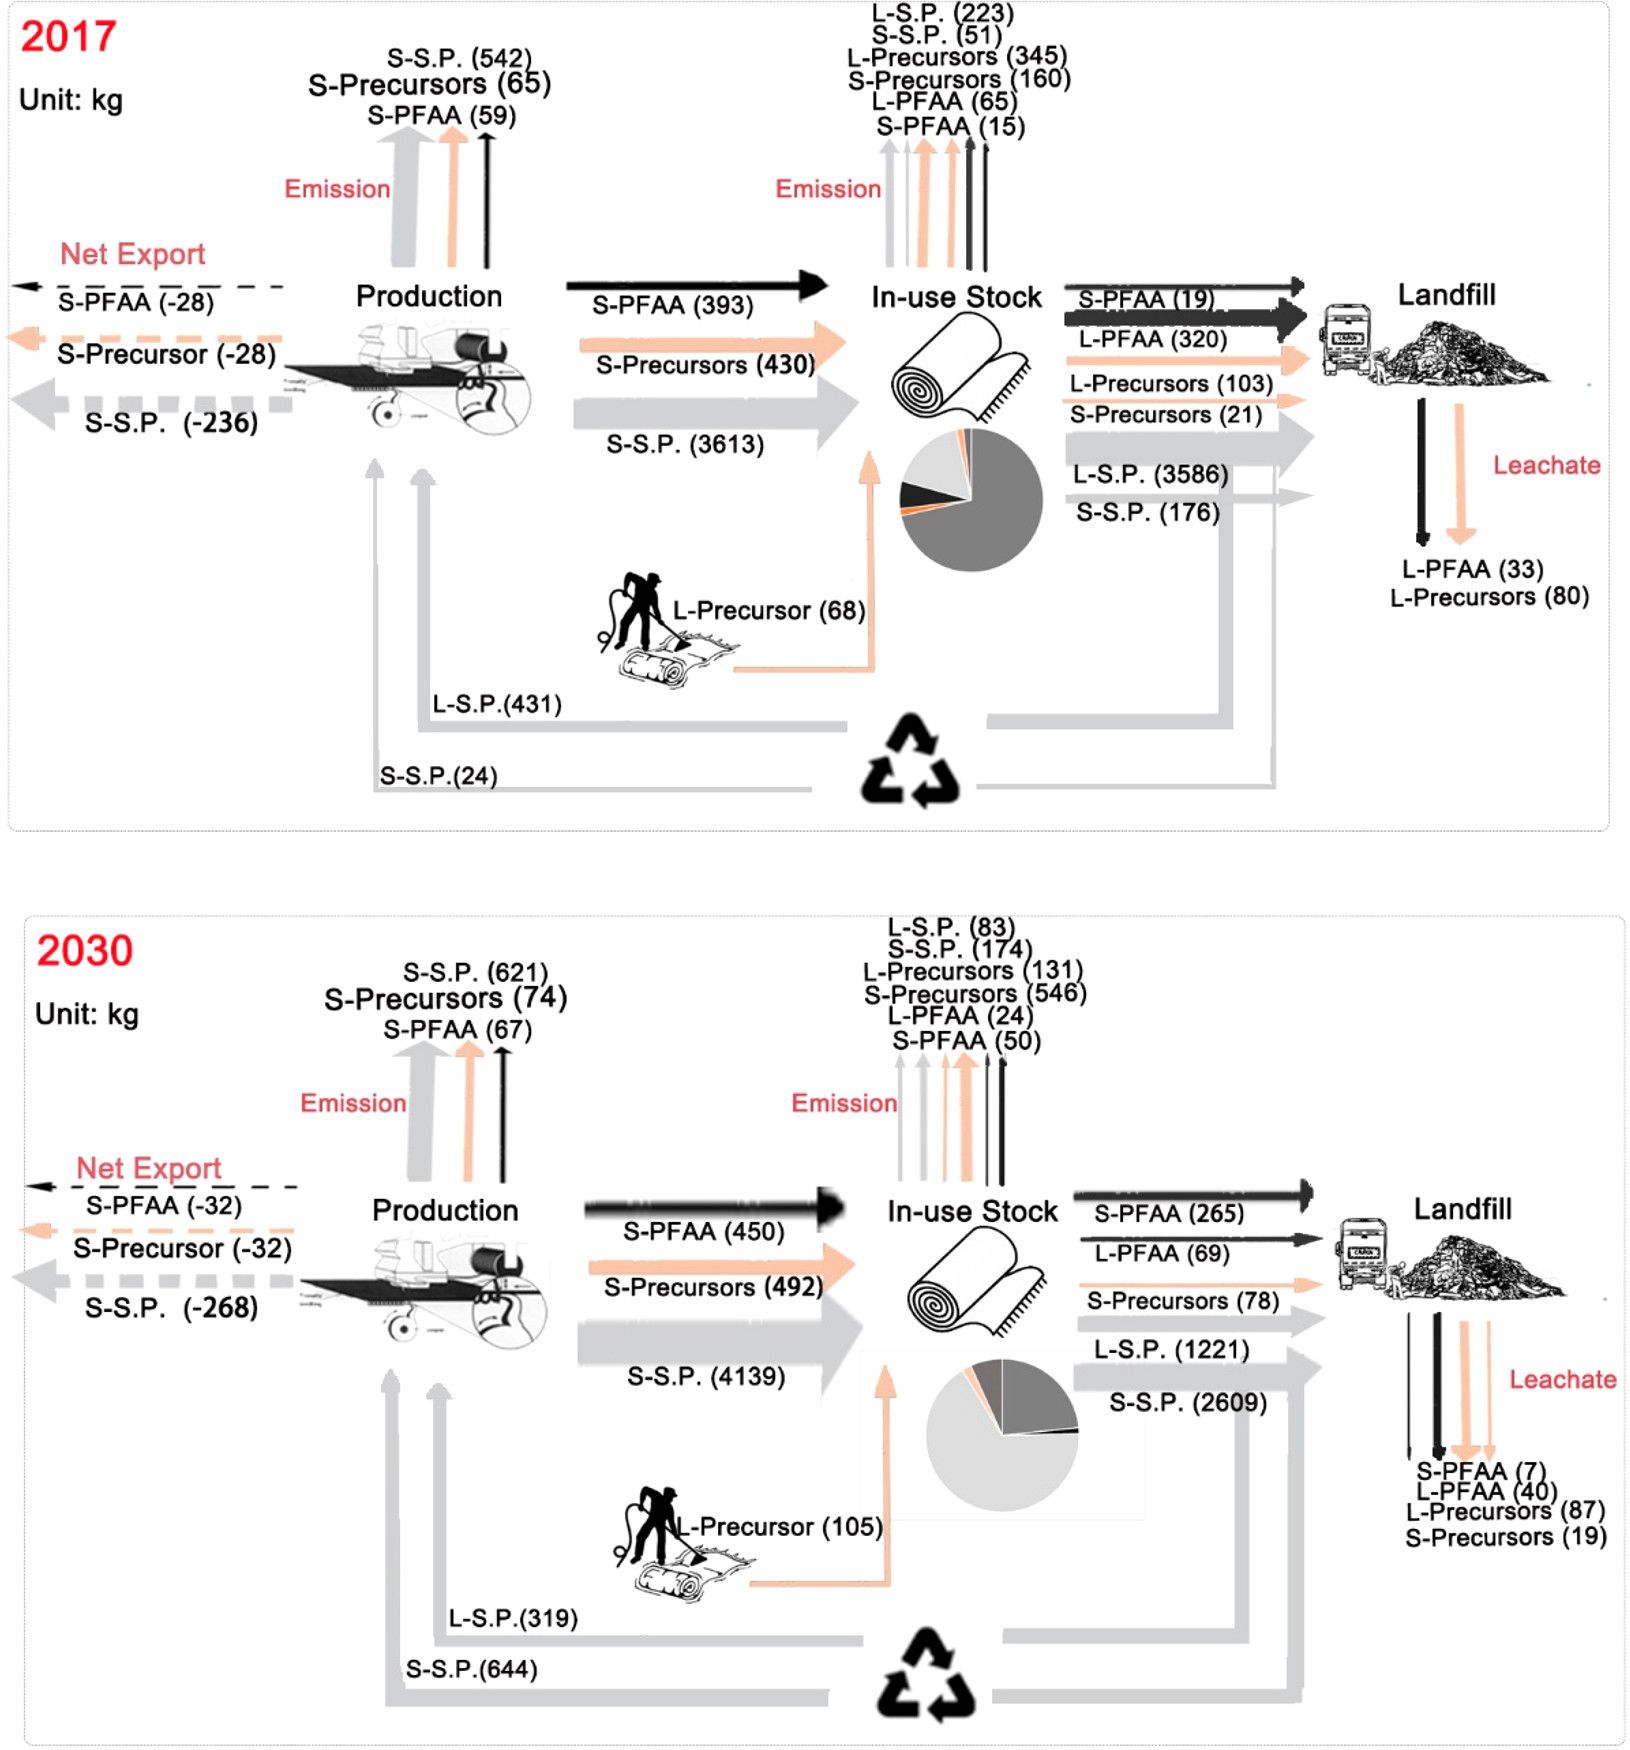
In this study, we present a holistic analysis of the stock and emissions of poly- and perfluoroalkyl substances (PFAS) in California carpet in 2000–2030. Our high estimate is that, in 2017, the total PFAS accumulated in in-use carpet stock and landfilled carpet are ∼60 and ∼120 tonnes, respectively, and the resultant PFAS emissions are ∼800 and ∼100 kg, respectively. Among the three subclasses (side-chain polymers, PFAA, and nonpolymeric precursors), side-chain polymers dominate the in-use stock and landfill accumulation, while nonpolymeric precursors dominate the resultant emissions. Our low estimate is typically 8–15% of the high estimate and follows similar trends and subclass breakdowns as the high estimate. California’s new Carpet Stewardship Regulations (24% recycling of end-of-life carpet) will reduce the landfilled PFAS by 6% (7 tonnes) at the cost of increasing the in-use stock by 2% (2 tonnes) in 2030. Aggressive PFAS phase-out by carpet manufacturers (i.e., reduce PFAS use by 15% annually starting 2020) could reduce the in-use PFAS stock by 50% by 2030, but its impact on the total landfilled PFAS is limited. The shift toward short-chain PFAS will also significantly reduce the in-use stock of long-chain PFAS in carpet by 2030 (only 25% of the total PFAS will be long-chain). Among the data gaps identified, a key one is the current area-based PFAS emission reporting (i.e., g PFAS emitted/area carpet/time), which leads to the counterintuitive result that reducing the PFAS use in carpet production has no impact on the PFAS emissions from in-use stock and landfills. Future technical studies should either confirm this or consider a mass-based unit (e.g., g PFAS emitted/g PFAS used/time) for better integration into regional substance flow analysis. Other noticeable data gaps include the lack of time-series data on emissions from the in-use stock and on leaching of side-chain polymers from landfills.
Graphic Abstract
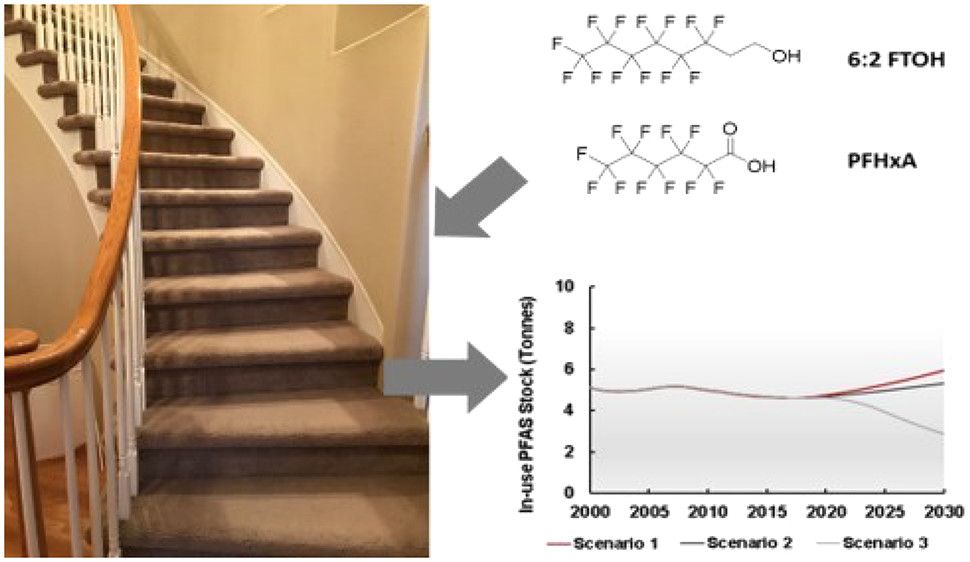
PFAS flows and emissions through California carpet in 2017 and 2030. Numbers in parentheses are the PFAS flows in kg.